Overview
This study, co-authored by Jungmok Seo (then at Brigham and Women's Hospital, Harvard Medical School, the Harvard-MIT Division of Health Sciences and Technology and the Korea Institute of Science and Technology), who now leads the BLISS Lab at Yonsei University, developed interconnectable bioreactors in which gas-actuated posts cyclically compress arrays of human mesenchymal stem cell (hMSC)-laden gelatin methacryloyl (GelMA) hydrogels. Each bioreactor held 16 samples and applied strains of 10.5 ± 1.8 to 42 ± 8.1% at 14 kPa, and 42% strain in 5% GelMA produced significantly higher calcium deposition than all other strain groups at 21 days.
Background
Cells respond to matrix stiffness and to applied mechanical loads through mechanotransduction, but medium- to high-throughput screening platforms have mostly examined two-dimensional cultures under static conditions. Earlier three-dimensional platforms applied compression or tension to hydrogel arrays, for example the microfluidic compression platform of Moraes et al. for poly(ethylene glycol) (PEG) hydrogels, yet none had screened combinations of dynamic compressive strain and biomaterial composition under continuous perfusion of culture medium.
Design and approach
Each bioreactor stacks a polydimethylsiloxane (PDMS) nitrogen pressure chamber, a PDMS media chamber with a 4 × 4 array of posts on a thin membrane, and a methacrylate-treated glass lid. Cell-laden GelMA prepolymer is injected into the media chamber and photocrosslinked through a mask onto the posts, so each hydrogel sits between a post and the glass; uncrosslinked prepolymer can be recovered and injected into the next device. Gas pressure deflects the membrane and lifts the posts, and the compressive strain on each hydrogel is set by the diameter of the pressure chamber beneath it and by the applied pressure. Several bioreactors carrying different GelMA concentrations are connected to a shared media reservoir, peristaltic pump and gas pressure module, so strain and matrix composition are varied in parallel.
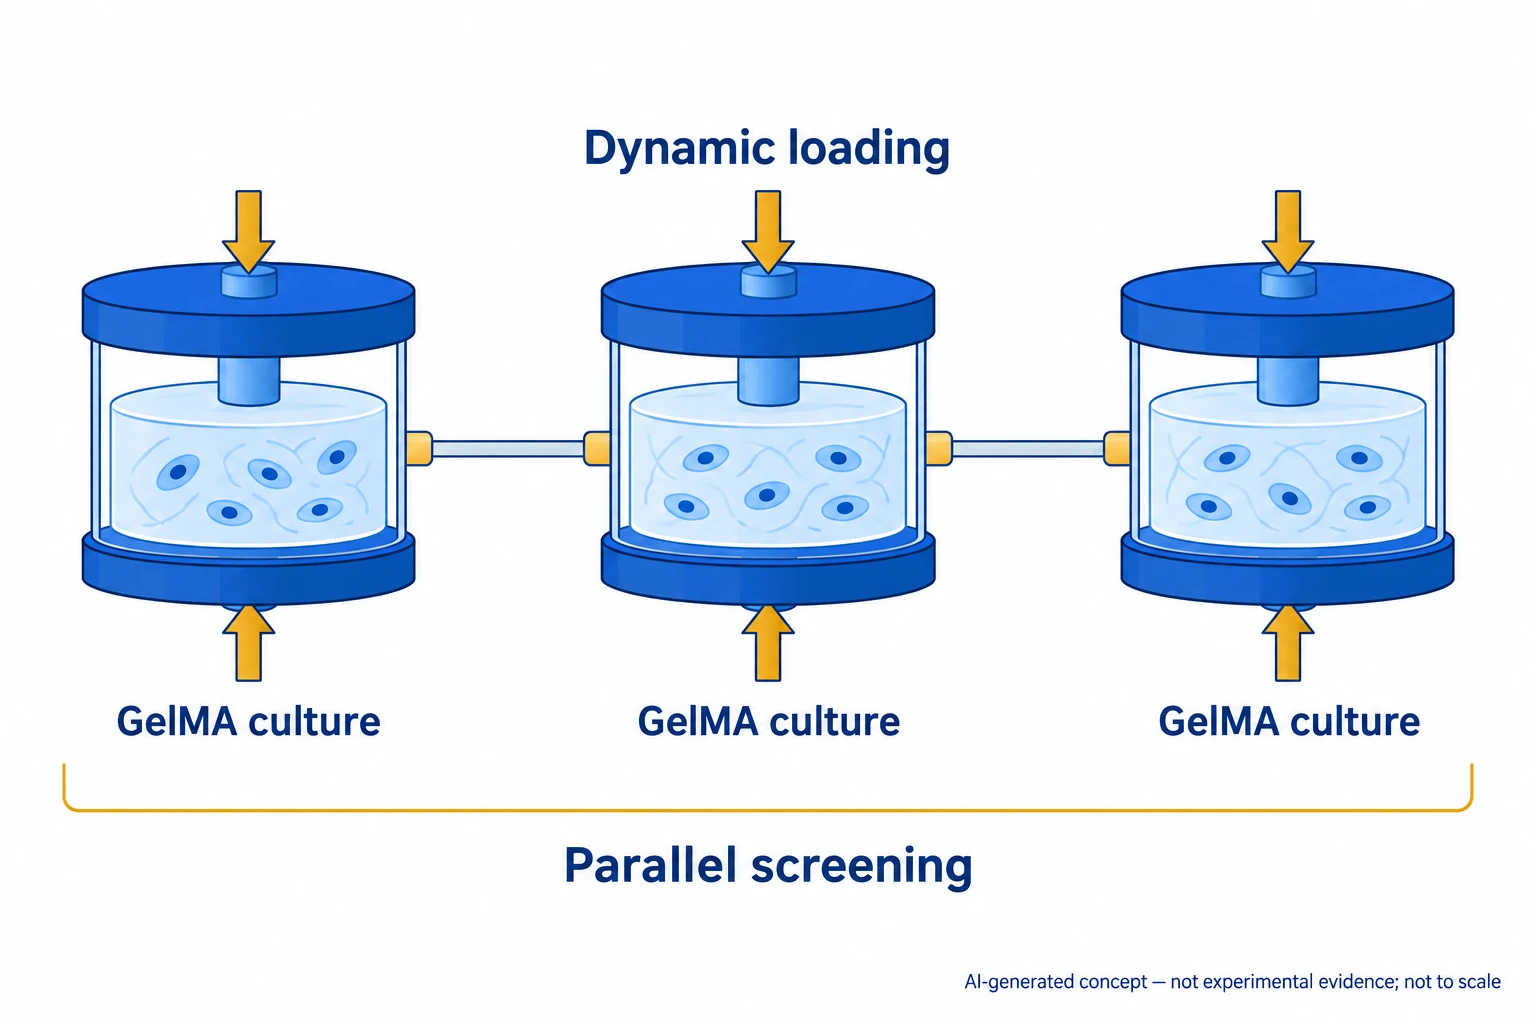
AI-generated, not-to-scale concept of parallel screening through interconnected modules applying dynamic compression to three-dimensional cell culture in GelMA.
Generated for this library to illustrate the design; it is not a figure from the paper and does not show measured data.
How it was evaluated
Post displacement was measured for pressures of 14 to 42 kPa and chamber diameters of 5 to 8 mm, compared with finite element simulations, and cycled 30,000 times. GelMA at 5, 7.5 and 10% was characterized by compression testing, and the strain distribution inside a hydrogel was simulated. hMSCs from bone marrow of healthy donors were encapsulated and perfused at 100 μL/min under 0.3 Hz compression (1.5 s compression, 1.5 s relaxation) at nominal strains of 0, 10, 27 and 42%. Viability (Live/Dead, 7 days, 5% GelMA) and cell area and aspect ratio (5 days, continuous loading) were measured. Osteogenic differentiation was examined at 1 × 10^7 cells/mL with loading for 3 h/day, using alkaline phosphatase (ALP) activity, Runt-related transcription factor 2 (Runx2) expression, osteocalcin (OCN) and osteopontin (OPN) staining, and calcium deposition up to 21 days.
Key results
Compressive strain increased with applied pressure and chamber diameter, the measurements agreed with simulation, and post displacement stayed stable over 30,000 cycles; by changing device parameters and pressure, displacement could be set from 0 to nearly 90%. With a 450 μm membrane at 14 kPa, chambers of 5 to 8 mm displaced the posts by 0.15 ± 0.03 to 0.63 ± 0.12 mm and compressed the hydrogels by 10.5 ± 1.8 to 42 ± 8.1%. The 5, 7.5 and 10% GelMA hydrogels had compressive moduli of 5, 19 and 29 kPa and fully recovered their thickness after unloading. Loading a hydrogel reduced the nominal 42% strain to 38%, but the difference was below 6% in all conditions and not significant, and simulations placed the largest strain at the post side and the smallest at the glass side.
Viability remained above 80% under all compression regimes over 7 days, with small decreases at 27 and 42% strain after 5 days. Without compression, cell area and aspect ratio decreased as GelMA concentration increased, and the mean pore size was 1.91 ± 0.81 μm in 10% GelMA versus 18.24 ± 4.52 μm in 5% GelMA. Cell spreading increased with compressive strain at every concentration, most strongly in 5% GelMA, where 42% cyclic strain substantially increased spreading.
In a 7-day screen, ALP activity increased with strain in 5% GelMA, whereas compression had no significant effect in 7.5 and 10% GelMA. In 5% GelMA, Runx2 expression at day 7 was significantly higher at 42% strain than at 0, 10 and 27%, ALP activity rose significantly at 27% (day 7) and 42% (days 7 and 21), and at 21 days OCN, OPN and calcium staining were more intense at 42% than at 0%. Calcium deposition at 21 days was significantly higher in the 42% group than in all other groups, with no significant difference among the lower strains. DNA content fell by 36 to 42% from day 7 to day 21 within each group without differences among strains.
Open questions
The simulation did not include cells, so actual strain values may differ from the predicted distributions. Because GelMA carries cell adhesion domains, changing macromer concentration alters adhesivity and pore size together, and the authors propose GelMA with different degrees of methacrylation to separate these effects. Some encapsulated cells may have washed out with medium movement during long-term culture. The authors also note that non-invasive in situ sensors for O2, pH and CO2 would help monitor the culture environment. The viability sample size is given as N = 4 in the Figure 4 legend and N = 5 in the Methods.
Related research
Matrix elasticity directs stem cell lineage specification
DOI: 10.1016/j.cell.2006.06.044 ↗
A study linking matrix elasticity with mesenchymal stem-cell (MSC) lineage illustrates why matrix properties and applied loading need separate consideration.
Abstract-based introductionSources used in this summary
This summary is based on the publisher PDF of the article (ACS Appl. Mater. Interfaces 2018, 10, 13293-13303; 11 pages, local copy), including the abstract, main text, Figure 1-6 legends, Experimental Section and author information; the Supporting Information and movies were not reviewed, and values shown only in figure panels were not used.